
Rio Muni: Difference between revisions
No edit summary |
No edit summary |
||
| Line 226: | Line 226: | ||
= Exposure to climate change impacts = | = Exposure to climate change impacts = | ||
As part of a study on the exposure of African great ape sites to climate change impacts, Kiribou et al. | As part of a study on the exposure of African great ape sites to climate change impacts, Kiribou et al. (2024) extracted climate data and data on projected extreme climate impact events for the site. Climatological characteristics were derived from observation-based climate data provided by the Inter-Sectoral Impact Model Intercomparison Project (ISIMIP, www.isimip.org). Parameters were calculated as the average across each 30-year period. For 1981-2010, the EWEMBI dataset from ISIMIP2a was used. For the two future periods (2021-2050 and 2071-2099) ISIMIP2b climate data based on four CMIP5 global climate models were used. For future projections, two Representative Concentration Pathways (RCP) were used. RCP 2.6 is a scenario with strong mitigation measures in which global temperatures would likely rise below 2C. RCP 6.0 is a scenario with medium emissions in which global temperatures would likely rise up to 3C by 2100. For the number of days with heavy precipitation events, the 98th percentile of all precipitation days (>1mm/d) was calculated for the 1979-2013 reference period as a threshold for a heavy precipitation event. Then, for each year, the number of days above that threshold was derived. The figures on temperature and precipitation anomaly show the deviation from the mean temperature and mean precipitation for the 1979-2013 reference period. | ||
The estimated exposure to future extreme climate impact events (crop failure, drought, river flood, wildfire, tropical cyclone, and heatwave) is based on a published dataset by Lange et al. 2020 derived from ISIMIP2b data. The same global climate models and RCPs as described above were used. Within each 30-year period, the number of years with an extreme event and the average proportion of the site affected were calculated ( | The estimated exposure to future extreme climate impact events (crop failure, drought, river flood, wildfire, tropical cyclone, and heatwave) is based on a published dataset by Lange et al. 2020 derived from ISIMIP2b data. The same global climate models and RCPs as described above were used. Within each 30-year period, the number of years with an extreme event and the average proportion of the site affected were calculated (Kiribou et al. 2024). | ||
'''Table 8. Estimated past and projected climatological characteristics in Rio Muni''' | '''Table 8. Estimated past and projected climatological characteristics in Rio Muni''' | ||
Revision as of 08:19, 3 September 2026
Central Africa > Equatorial Guinea > Rio Muni
Français | Português | Español | Bahasa Indonesia | Melayu
Summary
- Central chimpanzees (Pan troglodytes troglodytes) & western lowland gorillas (Gorilla gorilla gorilla) are present in Rio Muni.
- It has been estimated that 11,097 (CI: 8,719–13,592) great apes occur in the site.
- The great ape population trend is unknown.
- The site has a total size of 26,017 km².
- Key threats to great apes are extensive commercial hunting, expansion of roads, and human encroachment.
- Conservation activities are not documented.
Site characteristics
Río Muni, the mainland region of Equatorial Guinea, is bordered by Cameroon to the north, and Gabon to the east and south. The area covers 26,017 sq. km; vegetations largely consists of Guineo-Congolian rainforest, mangrove forests in the southwest estuary, riparian palm forests along the coast, and some inselbergs in the east (Murai et al. 2013).The region has rich faunal diversity that includes gorillas, chimpanzees, various monkeys, leopards, buffalo, antelope, elephants, hippopotamuses, crocodiles, and various snakes, including pythons (Britannica).
Table 1. Basic site information for Rio Muni
| Species | Pan troglodytes troglodytes, Gorilla gorilla gorilla |
| Area | 26,017 km² |
| Coordinates | Lat: 1.700144 , Lon: 10.472875 |
| Type of site | Non-protected area |
| Habitat types | Subtropical/tropical moist lowland forest, Subtropical/tropical moist montane forest |
| Type of governance |
Types of sites Governance types Habitat types
Ape status
The estimated great ape population in 2011 was 11,097, including a maximum population of 7,824 chimpanzees and a minimum population of 3,273 gorillas (Murai et al. 2013).
Table 2. Ape population estimates reported for Rio Muni
| Species | Year | Occurrence | Encounter or vistation rate (nests/km; ind/day) | Density estimate [ind./ km²] (95% CI) | Abundance estimate (95% CI) | Survey area | Sampling method | Analytical framework | Source | Comments | A.P.E.S. database ID |
|---|---|---|---|---|---|---|---|---|---|---|---|
| Pan troglodytes troglodytes & Gorilla gorilla gorilla | 2011 | 11,097 (8,719-13,592) | Río Muni | Line transects | Murai et al. 2013 | Survey effort: 233.94 km |
Sampling methods Analytical frameworks
Threats
The expansion of roads across the region have facilitated heavy commercial hunting, which is in high demand with increasing population and wealth (Murai et al. 2013).
Table 3. Threats to apes reported for Rio Muni
| Category | Specific threats | Threat level | Description | Year of threat |
|---|---|---|---|---|
| 1 Residential & commercial development | 1.1 Residential areas | High (more than 70% of population affected) | In a 2013 study, proximity to cities and settlements were the strongest predictors of ape density, which decreased closer to human centres (Murai et al. 2013). | Ongoing (2013) |
| 2 Agriculture & aquaculture | 2.1 Annual & perennial non-timber crops | Medium (30-70% of population affected) | Great apes densities have been shown to negatively correlate with agricultural mosaic habitat (Murai et al. 2013). | Ongoing (2013) |
| 4 Transportation & service corridors | 4.1 Roads & railroads | High (more than 70% of population affected) | Expansion of the road network across the region facilitates commercial hunting and deforestation (Murai et al. 2013). | Ongoing (2013) |
| 5 Biological resource use | 5.1 Hunting & collecting terrestrial animals | High (more than 70% of population affected) | Extensive commercial hunting and large urban bushmeat markets in the region (Murai et al. 2013). | Ongoing (2013) |
| 5 Biological resource use | 5.3 Logging & wood harvesting | High (more than 70% of population affected) | Forest concessions significantly increased since the discovery of oil reserves in the early 1990s; by 2001, forest concessions covered 1.7 million hectares (Murai et al. 2013). | 1990-Ongoing (2001) |
Conservation activities
Challenges
Protected areas in Río Muni cover 15.4% of the country’s land, but there are limited law enforcement activities undertaken to manage and protect these areas (Murai et al. 2013).
Table 5. Challenges reported for Rio Muni
| Challenges | Specific challenges | Source | Year(s) |
|---|---|---|---|
| 4 Institutional support | 4.1 Lack of law enforcement | Murai et al. 2013 |
Enablers
Table 6. Enablers reported for Rio Muni
| Enablers | Specific enablers | Source | Year(s) |
|---|---|---|---|
| 1 Site management | |||
| 2 Resources and capacity | |||
| 3 Engaged community | |||
| 4 Institutional support | |||
| 5 Ecological context | |||
| 6 Safety and stability |
Research activities
Determinants of urban bushmeat consumption in Río Muni, Equatorial Guinea
Documented behaviours
Table 7. Behaviours documented for Rio Muni
| Category | Behavior | Observation type | Prevalence | Observation dates | Source | Habituation | Species | Comment |
|---|---|---|---|---|---|---|---|---|
| Not reported |
Exposure to climate change impacts
As part of a study on the exposure of African great ape sites to climate change impacts, Kiribou et al. (2024) extracted climate data and data on projected extreme climate impact events for the site. Climatological characteristics were derived from observation-based climate data provided by the Inter-Sectoral Impact Model Intercomparison Project (ISIMIP, www.isimip.org). Parameters were calculated as the average across each 30-year period. For 1981-2010, the EWEMBI dataset from ISIMIP2a was used. For the two future periods (2021-2050 and 2071-2099) ISIMIP2b climate data based on four CMIP5 global climate models were used. For future projections, two Representative Concentration Pathways (RCP) were used. RCP 2.6 is a scenario with strong mitigation measures in which global temperatures would likely rise below 2C. RCP 6.0 is a scenario with medium emissions in which global temperatures would likely rise up to 3C by 2100. For the number of days with heavy precipitation events, the 98th percentile of all precipitation days (>1mm/d) was calculated for the 1979-2013 reference period as a threshold for a heavy precipitation event. Then, for each year, the number of days above that threshold was derived. The figures on temperature and precipitation anomaly show the deviation from the mean temperature and mean precipitation for the 1979-2013 reference period.
The estimated exposure to future extreme climate impact events (crop failure, drought, river flood, wildfire, tropical cyclone, and heatwave) is based on a published dataset by Lange et al. 2020 derived from ISIMIP2b data. The same global climate models and RCPs as described above were used. Within each 30-year period, the number of years with an extreme event and the average proportion of the site affected were calculated (Kiribou et al. 2024).
Table 8. Estimated past and projected climatological characteristics in Rio Muni
| Value | 1981-2010 | 2021-2050, RCP 2.6 | 2021-2050, RCP 6.0 | 2071-2099, RCP 2.6 | 2071-2099, RCP 6.0 |
|---|---|---|---|---|---|
| Mean temperature [C] | 25.4 | 26.5 | 26.4 | 26.7 | 27.7 |
| Annual precipitation [mm] | 4288 | 4376 | 4330 | 4486 | 4372 |
| Max no. consecutive dry days (per year) | 34.9 | 12 | 9.7 | 11.1 | 10.1 |
| No. days with heavy precipitation (per year) | 6.8 | 10.6 | 10.8 | 10.5 | 11.1 |
Table 9. Projected exposure of apes to extreme climate impact events in Rio Muni
| Type | No. of years with event (2021-2050, RCP 2.6) | % of site exposed (2021-2050, RCP 2.6) | No. of years with event (2021-2050, RCP 6.0) | % of site exposed (2021-2050, RCP 6.0) | No. of years with event (2070-2099, RCP 2.6) | % of site exposed (2070-2099, RCP 2.6) | No. of years with event (2070-2099, RCP 6.0) | % of site exposed (2070-2099, RCP 6.0) |
|---|---|---|---|---|---|---|---|---|
| Crop failure | 2.5 | 0.01 | 6 | 0.01 | 5.5 | 0.01 | 9 | 0.01 |
| Drought | 0 | 0 | 0 | 0 | 0 | 0 | 0 | 0 |
| Heatwave | 7 | 100 | 8.5 | 100 | 7 | 100 | 19.5 | 100 |
| River flood | 1.5 | 2.03 | 1.25 | 5.65 | 0.5 | 1.05 | 5 | 5.3 |
| Tropical cyclone | 0 | 0 | 0 | 0 | 0 | 0 | 0 | 0 |
| Wildfire | 0.5 | 0.05 | 0 | 0 | 0.5 | 0.05 | 0.5 | 0.05 |
-
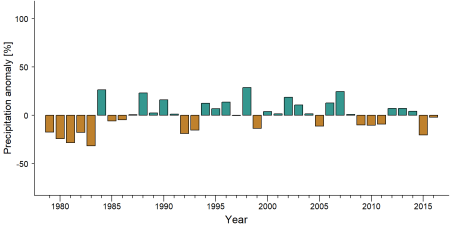
Precipitation anomaly in Rio Muni -
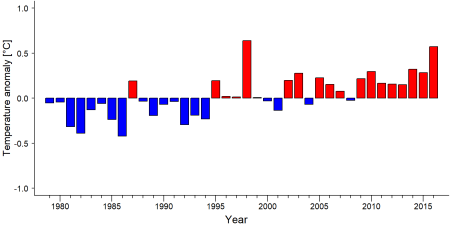
Temperature anomaly in Rio Muni


External links
References
Murai M, Ruffler H, Berlemont A, Campbell G, Esono F, Agbor A, et al. (2013) Priority Areas for Large Mammal Conservation in Equatorial Guinea. PLoS ONE 8(9): e75024. https://doi.org/10.1371/journal.pone.0075024
Page created by: APES Atlas Team Date: 2021-01-14